Stats
The Stats board gives you a heads up as to what's going on with your controller
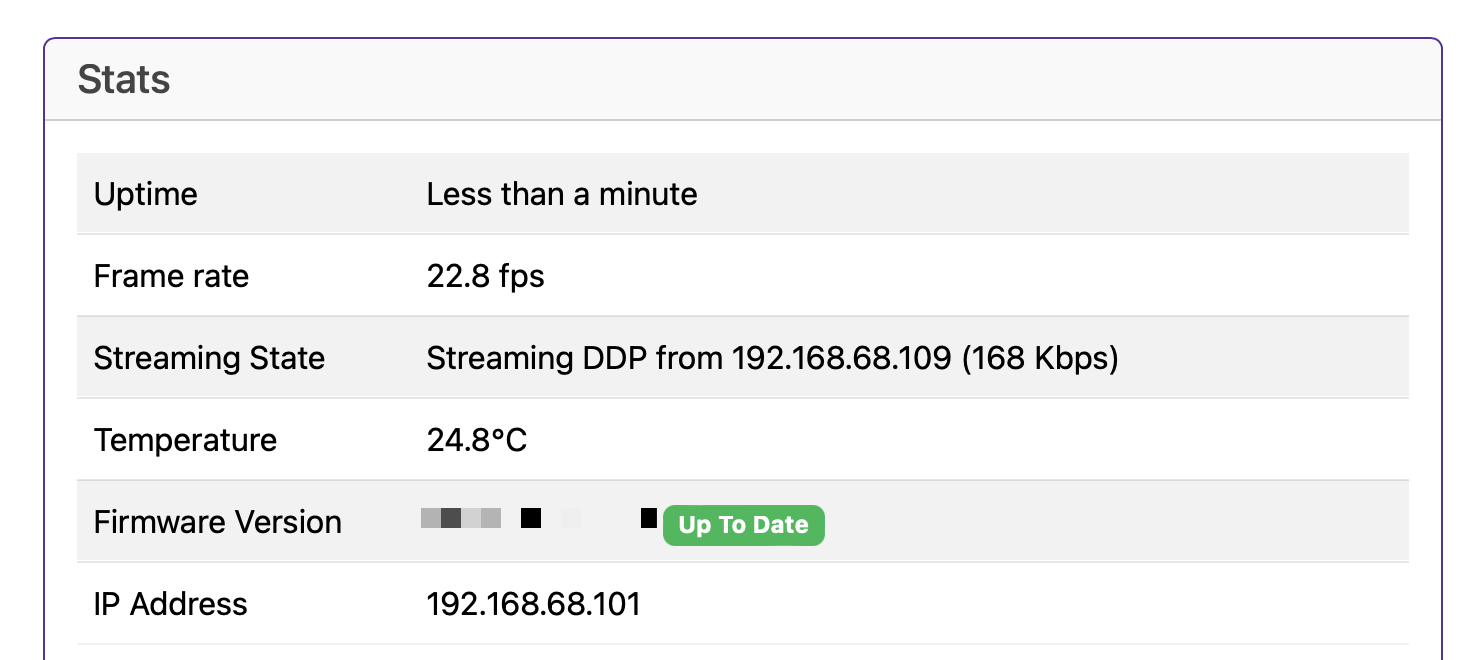
Uptime
Tells you how long your controller has been powered on (this is useful in June to remind you that you forgot to turn it off over christmas)
Frame Rate
This lets you know what the FPS (Frames Per Second) the controller is currently outputting (The Baldrick8 has been optimised to output 750 pixels per port at 40fps
Streaming State
Will indicate if the board is receiving data from a specific IP address and what type of data. The board will also show if two IPs are streaming to the board at the same time which is very useful for debugging those pesky problems
Network Throughput
Like the FPS, this gives you an indication of the volume of network traffic passing through the controller, this should help with debugging
Temperature
With a sensor next to the Ethernet connector, this gives you an indication of the board temperature (in Celsius) because water freezes at 0, not 32.. how does that make sense?
Generally, PCBs and components are good for -40 to +85°C, Anything below 60°C on this board is fine and nothing to worry about. If the temp is above that, try blowing on it like you would a hot chip out of the oven.
Firmware Version
The Baldrick8 is pretty new in the world of controllers and we've got a LOT of features left to add, this will let you know your current version and if there is a version to upgrade to.
(clicking the new version will upgrade it in place then restart the controller)
IP Address
It would be pretty silly to have a controller information box without showing you the IP Address of the controller wouldn't it? That would be like launching a controller without being able to manage the networking.